Nowadays you can find calendar heatmaps on every GitHub profile. The first time I saw a one, it was the winning entry for the JSM Data Expo in 2009. What amazed me most was that it was created in SAS which is not especially well-known for nice visualisations. Only a short time later the R community was able to replicate similar calendar heatmaps thanks to Paul Bleicher’s lattice based implementation.
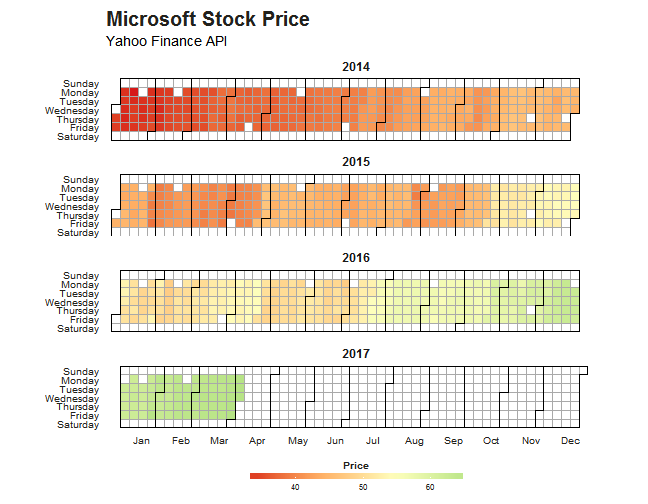
Being always a big fan of Hadley Wickham’s ggplot2 I wanted to implement my own calendar heatmap version in ggplot2. For plotting your own time-series you only need the ggplot2 package and the following function. The lubridate package might come in handy to transform the dates. One nice feature of my solution is that you can adjust the ggplot object as you like.
Preview

Code
#' Calendar Heatmap
#'
#' Creates a colour coded calendar visualising time series data
#'
#' @param dates A vector containing the dates in `Date` format.
#' @param values A vector containing the corresponding values as numeric.
#' @param title Main plot title (optional).
#' @param subtitle Main plot subtitle (optional).
#' @param legendtitle Legend title (optional).
#'
#' @return ggplot object
calendarHeatmap <- function(dates, values, title = "", subtitle = "", legendtitle = ""){

  # Parameter checks
  if(missing(dates)){
    stop("Need to specify a dates vector.")
  }
  if(missing(values)){
    stop("Need to specify a values vector.")
  }
  if(!is.Date(dates)){
    stop("dates vector need to be in Date format.")
  }
  if(length(dates) != length(values)){
    stop("dates and values need to have the same length.")
  }


  # load required packages
  require(ggplot2)

  my_theme <- function() {

    # Colors
    color.background = "white"
    color.text = "#22211d"

    # Begin construction of chart
    theme_bw(base_size=15) +

      # Format background colors
      theme(panel.background = element_rect(fill=color.background, color=color.background)) +
      theme(plot.background  = element_rect(fill=color.background, color=color.background)) +
      theme(panel.border     = element_rect(color=color.background)) +
      theme(strip.background = element_rect(fill=color.background, color=color.background)) +

      # Format the grid
      theme(panel.grid.major = element_blank()) +
      theme(panel.grid.minor = element_blank()) +
      theme(axis.ticks       = element_blank()) +

      # Format the legend
      theme(legend.position = "bottom") +
      theme(legend.text = element_text(size = 8, color = color.text)) +
      theme(legend.title = element_text(size = 10, face = "bold", color = color.text)) +

      # Format title and axis labels
      theme(plot.title       = element_text(color=color.text, size=20, face = "bold")) +
      theme(axis.text.x      = element_text(size=12, color="black")) +
      theme(axis.text.y      = element_text(size=12, color="black")) +
      theme(axis.title.x     = element_text(size=14, color="black", face = "bold")) +
      theme(axis.title.y     = element_text(size=14, color="black", vjust=1.25)) +
      theme(axis.text.x      = element_text(size=10, hjust = 0, color = color.text)) +
      theme(axis.text.y      = element_text(size=10, color = color.text)) +
      theme(strip.text       = element_text(face = "bold")) +

      # Plot margins
      theme(plot.margin = unit(c(0.35, 0.2, 0.3, 0.35), "cm"))
  }

  # create empty calendar
  min.date <- as.Date(paste(format(min(dates), "%Y"),"-1-1",sep = ""))
  max.date <- as.Date(paste(format(max(dates), "%Y"),"-12-31", sep = ""))
  df <- data.frame(date = seq(min.date, max.date, by="days"), value = NA)

  # fill in values
  df$value[match(dates, df$date)] <- values

  df$year  <-  as.factor(format(df$date, "%Y"))
  df$month <- as.numeric(format(df$date, "%m"))
  df$doy   <- as.numeric(format(df$date, "%j"))
  #df$dow  <- as.numeric(format(df$date, "%u"))
  #df$woy  <- as.numeric(format(df$date, "%W"))
  df$dow <- as.numeric(format(df$date, "%w"))
  df$woy <- as.numeric(format(df$date, "%U")) + 1

  df$dowmapped <- ordered(df$dow, levels = 6:0)
  levels(df$dowmapped) <- rev(c("Sunday","Monday","Tuesday","Wednesday","Thursday","Friday","Saturday"))

  g <- ggplot(df, aes(woy, dowmapped, fill = value)) +
    geom_tile(colour = "darkgrey") +
    facet_wrap(~year, ncol = 1) + # Facet for years
    coord_equal(xlim = c(2.5,54)) + # square tiles
    scale_x_continuous(breaks = 53/12*(1:12)-1.5, labels = c("Jan","Feb","Mar","Apr","May","Jun","Jul","Aug","Sep","Oct","Nov","Dec")) +
    my_theme() +
    scale_fill_gradientn(colours = c("#D61818", "#FFAE63", "#FFFFBD", "#B5E384"), na.value = "white",
                         name = legendtitle,
                         guide = guide_colorbar(
                           direction = "horizontal",
                           barheight = unit(2, units = "mm"),
                           barwidth = unit(75, units = "mm"),
                           title.position = 'top',
                           title.hjust = 0.5
                         )) +
    labs(x = NULL,
         y = NULL,
         title = title,
         subtitle = subtitle)

  my.lines<-data.frame(x=numeric(),
                       y=numeric(),
                       xend=numeric(),
                       yend=numeric(),
                       year=character())

  for(years in levels(df$year)){
    df.subset <- df[df$year == years,]

    y.start <- df.subset$dow[1]
    x.start <- df.subset$woy[1]

    x.top.left <- ifelse(y.start == 0, x.start - 0.5, x.start + 0.5)
    y.top.left <- 7.5
    x.top.right <- df.subset$woy[nrow(df.subset)] + 0.5
    y.top.right <- 7.5

    x.mid.left01 <- x.start - 0.5
    y.mid.left01 <- 7.5 - y.start
    x.mid.left02 <- x.start + 0.5
    y.mid.left02 <- 7.5 - y.start

    x.bottom.left <- x.start - 0.5
    y.bottom.left <- 0.5
    x.bottom.right <- ifelse(y.start == 6, df.subset$woy[nrow(df.subset)] + 0.5, df.subset$woy[nrow(df.subset)] - 0.5)
    y.bottom.right <- 0.5

    my.lines<-rbind(my.lines,
                    data.frame(x    = c(x.top.left, x.bottom.left, x.mid.left01, x.top.left, x.bottom.left),
                               y    = c(y.top.left, y.bottom.left, y.mid.left01, y.top.left, y.bottom.left),
                               xend = c(x.top.right, x.bottom.right, x.mid.left02, x.mid.left02, x.mid.left01),
                               yend = c(y.top.right, y.bottom.right, y.mid.left02, y.mid.left02, y.mid.left01),
                               year = years))

    # lines to separate months
    for (j in 1:12)  {
      df.subset.month <- max(df.subset$doy[df.subset$month == j])
      x.month <- df.subset$woy[df.subset.month]
      y.month <- df.subset$dow[df.subset.month]

      x.top.mid <- x.month + 0.5
      y.top.mid <- 7.5

      x.mid.mid01 <- x.month - 0.5
      y.mid.mid01 <- 7.5 - y.month - 1
      x.mid.mid02 <- x.month + 0.5
      y.mid.mid02 <- 7.5 - y.month - 1

      x.bottom.mid <- ifelse(y.month == 6, x.month + 0.5, x.month - 0.5)
      y.bottom.mid <- 0.5

      my.lines<-rbind(my.lines,
                      data.frame(x    = c(x.top.mid, x.mid.mid01, x.mid.mid01),
                                 y    = c(y.top.mid, y.mid.mid01, y.mid.mid01),
                                 xend = c(x.mid.mid02, x.mid.mid02, x.bottom.mid),
                                 yend = c(y.mid.mid02, y.mid.mid02, y.bottom.mid),
                                 year = years))

    }

  }

  # add lines
  g <- g + geom_segment(data=my.lines, aes(x,y,xend=xend, yend=yend), lineend = "square", color = "black", inherit.aes=FALSE)

  return(g)
}
Example
In the following example I visualise Microsoft’s stock price starting from 2014 with the help of Yahoo Finance API.
stock <- "MSFT"
start.date <- "2014-00-01" # workaround for a small bug with the month extraction
end.date <- Sys.Date()
quote <- paste("http://ichart.finance.yahoo.com/table.csv?s=",
               stock,
               "&a=", substr(start.date,6,7),
               "&b=", substr(start.date, 9, 10),
               "&c=", substr(start.date, 1,4),
               "&d=", substr(end.date,6,7),
               "&e=", substr(end.date, 9, 10),
               "&f=", substr(end.date, 1,4),
               "&g=d&ignore=.csv", sep="")
stock.data <- read.csv(quote, as.is=TRUE)

require(lubridate)

dates <- ymd(stock.data$Date)
values <- stock.data$Adj.Close

calendarHeatmap(dates, values, title = "Microsoft Stock Price", subtitle = "Yahoo Finance API", legendtitle = "Price")

SessionInfo
## R version 3.3.1 (2016-06-21)
## Platform: x86_64-w64-mingw32/x64 (64-bit)
## Running under: Windows >= 8 x64 (build 9200)
##
## locale:
## [1] LC_COLLATE=German_Germany.1252  LC_CTYPE=German_Germany.1252
## [3] LC_MONETARY=German_Germany.1252 LC_NUMERIC=C
## [5] LC_TIME=German_Germany.1252
##
## attached base packages:
## [1] stats     graphics  grDevices utils     datasets  methods   base
##
## other attached packages:
## [1] ggplot2_2.2.1   lubridate_1.6.0 knitr_1.14
##
## loaded via a namespace (and not attached):
##  [1] Rcpp_0.12.6      digest_0.6.9     assertthat_0.1   grid_3.3.1
##  [5] plyr_1.8.4       gtable_0.2.0     formatR_1.4      magrittr_1.5
##  [9] evaluate_0.9     scales_0.4.1     stringi_1.1.1    lazyeval_0.2.0
## [13] labeling_0.3     tools_3.3.1      stringr_1.0.0    munsell_0.4.3
## [17] colorspace_1.2-6 tibble_1.1