Data Science 42
  • Blog
  • About Me
  • Projects

My projects


A collection of nice visualisations, algorithms and useful code snippets
Sankey Diagram

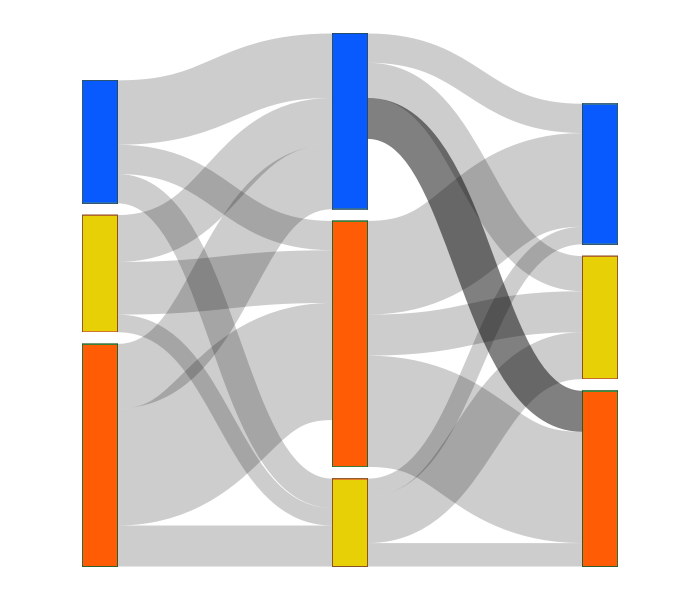
Visualise path data in an interactive flow diagram.

stoptype: Visualisation

stoptags: network-graphs

stoplibraries: networkD3 99

true
phylocanvasclose

(full meta data to go here)

Calendar Heatmap

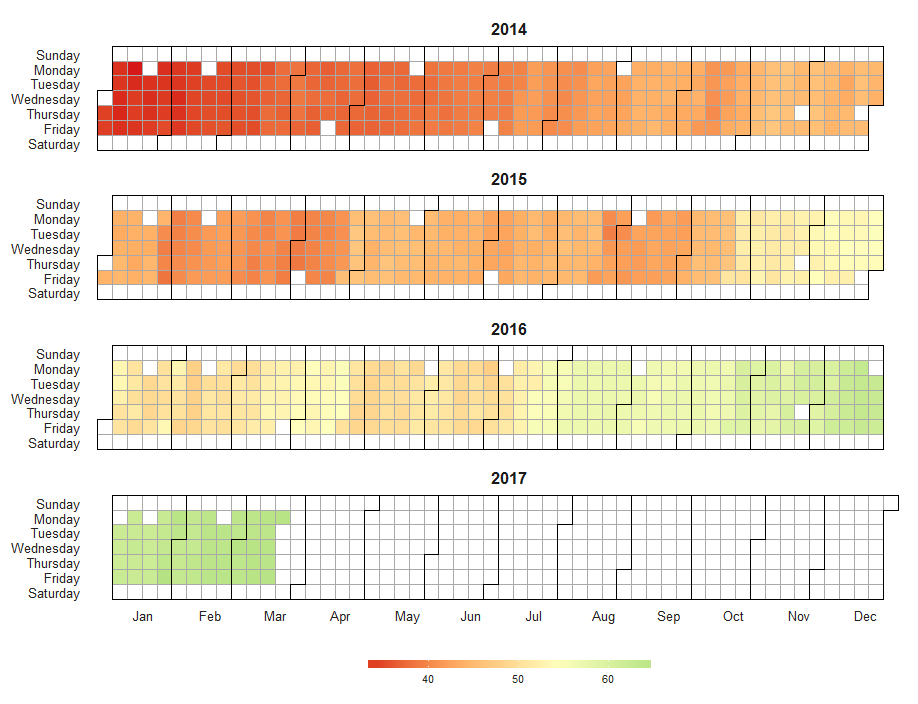
Visualise time series data in calendar style.

stoptype: Visualisation

stoptags: time-series

stoplibraries: ggplot2 1

true
Calendar Heatmapclose

(full meta data to go here)

Global Terrorism App

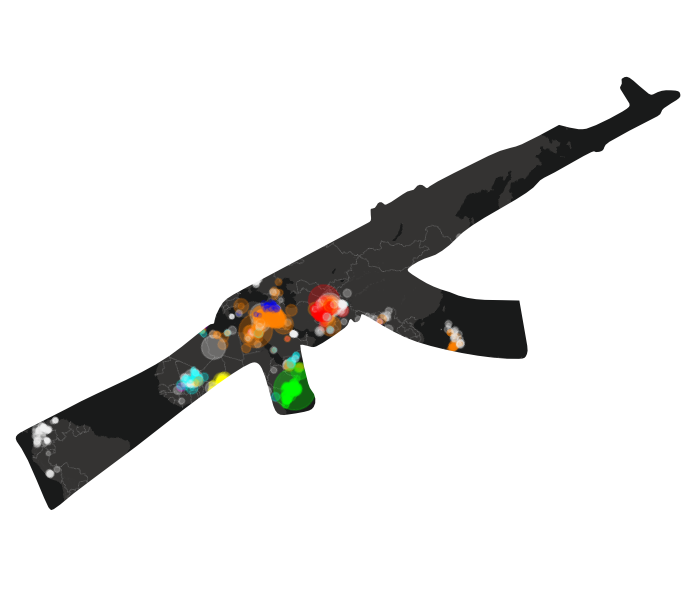
Highlight global terrorism on an interactive map.

stoptype: Dashboard

stoptags: interactive-maps,time-series

stoplibraries: shiny,leaflet,timevis 2

true
Global Terrorism Appclose

(full meta data to go here)

Bump Chart

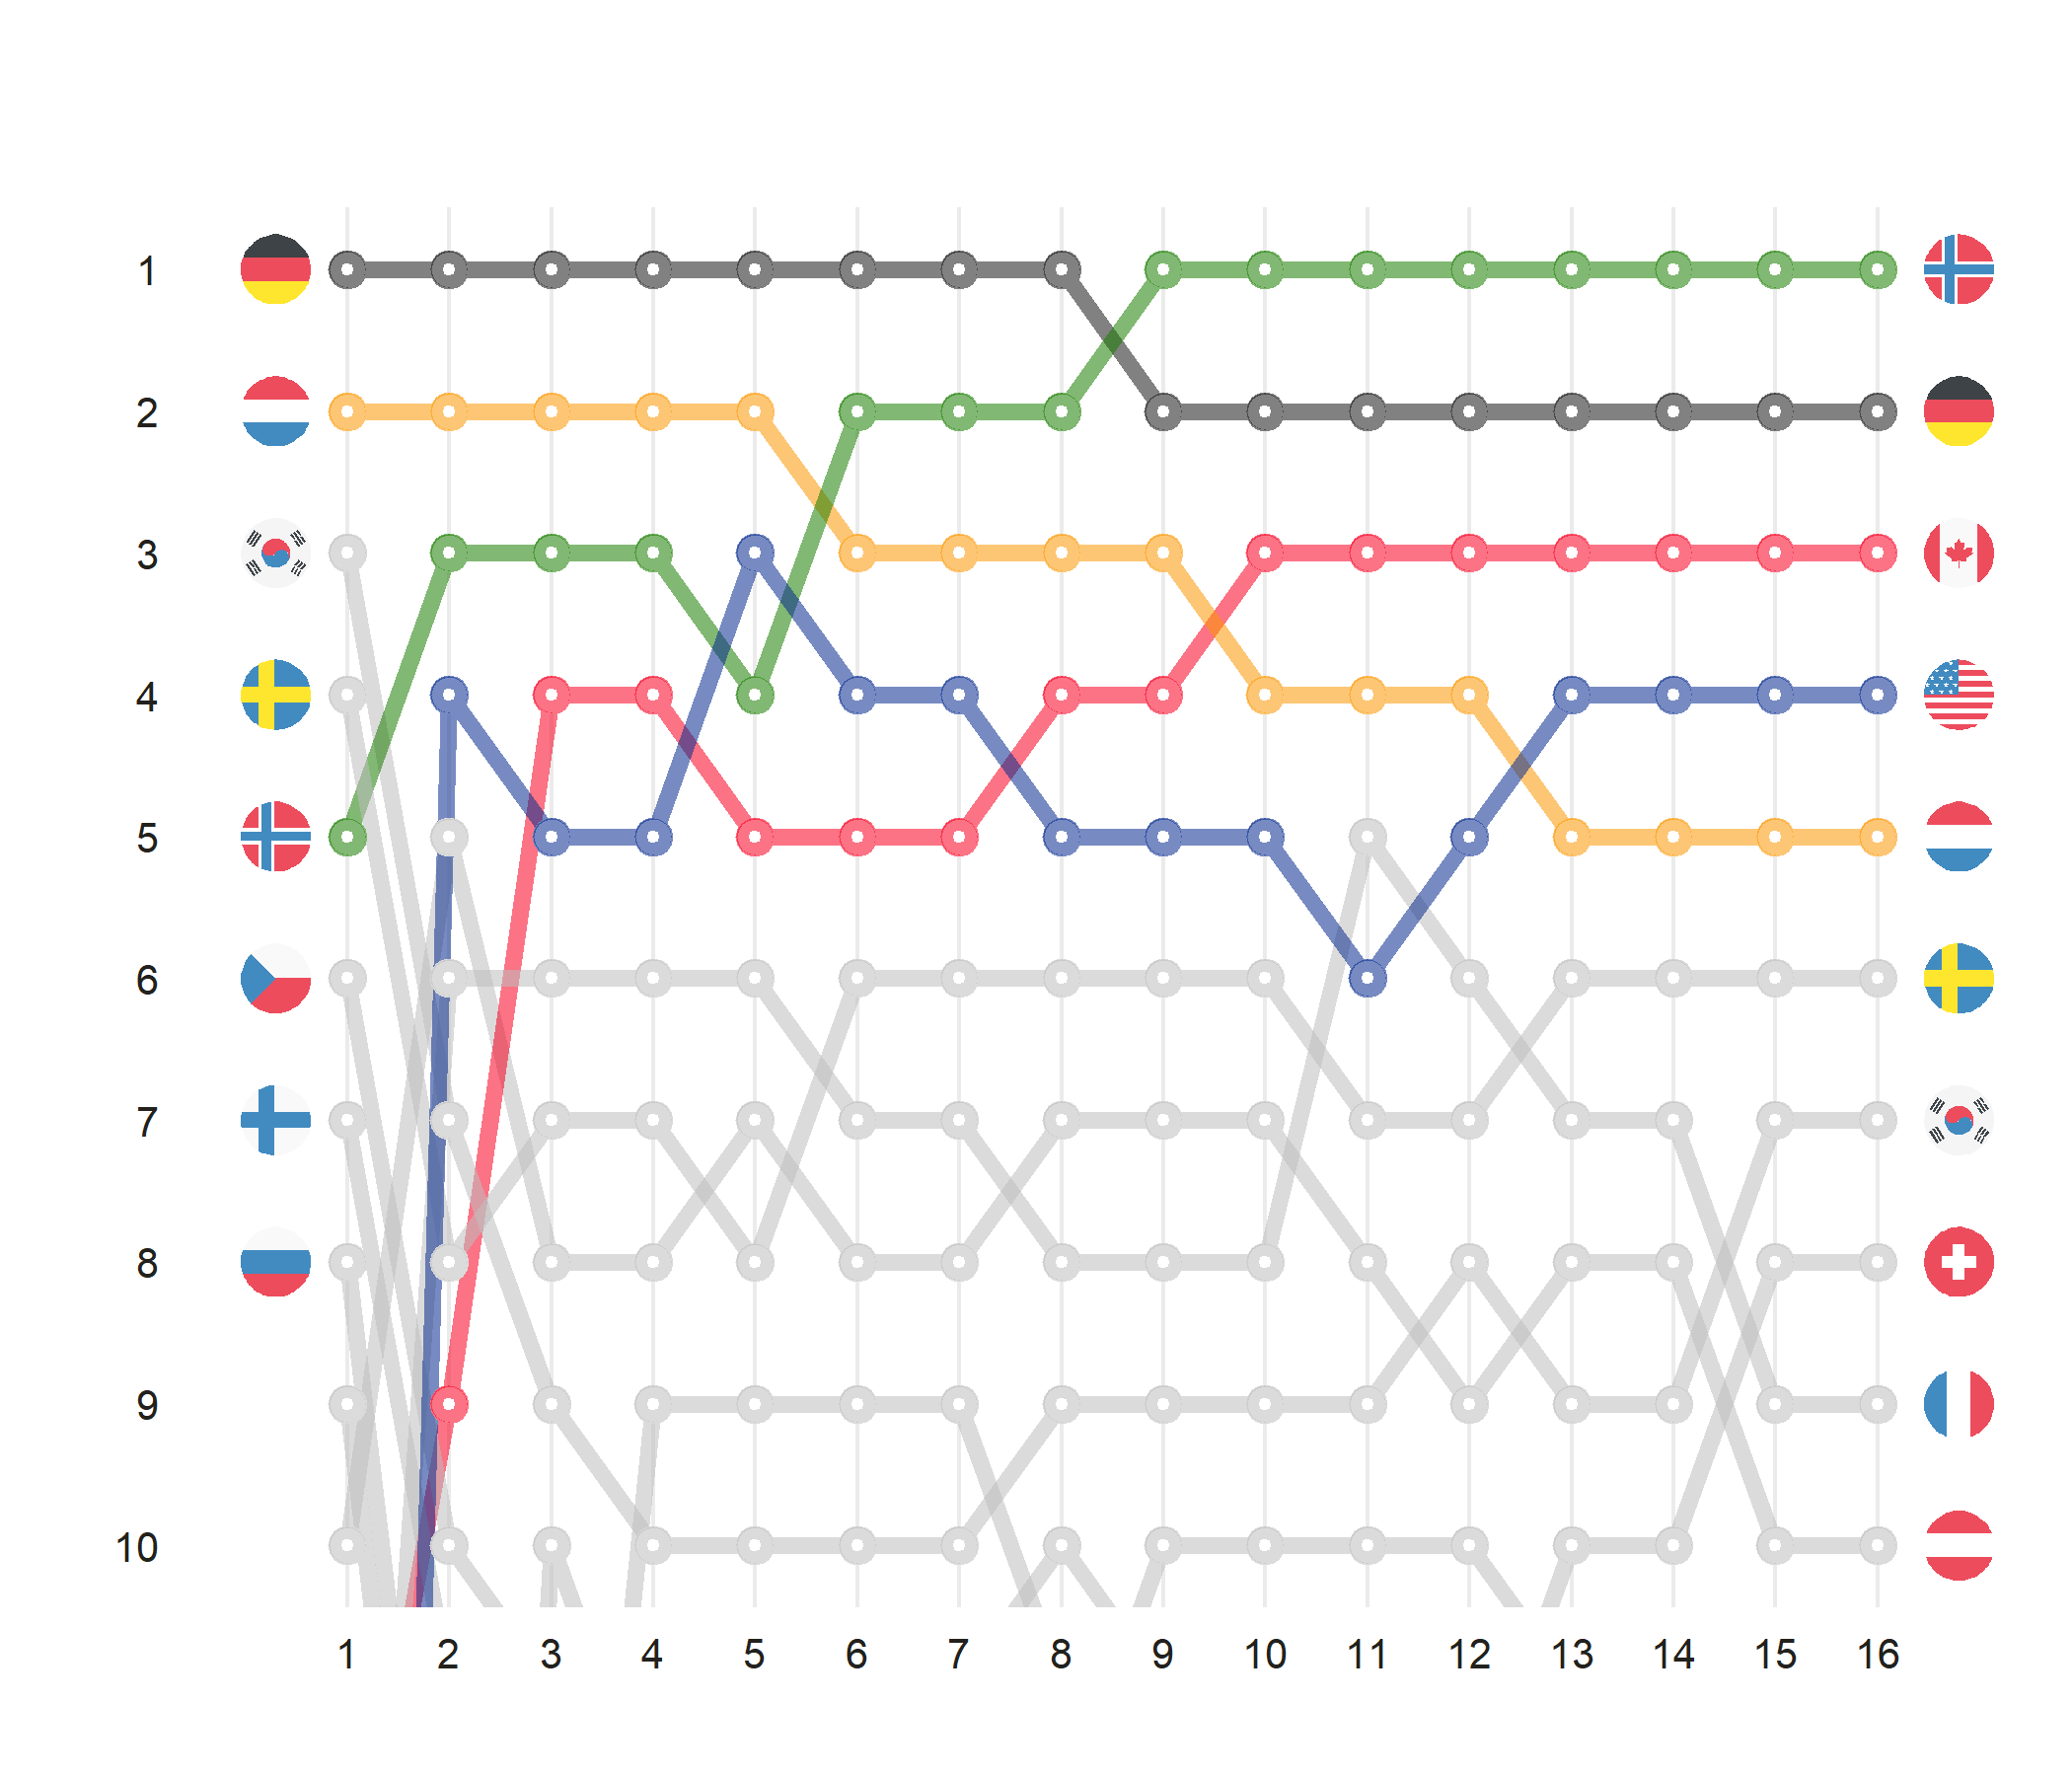
Track performance over time.


stoptype: Visualisation

stoptags: time-series,ranking

stoplibraries: ggplot2,ggflags 3

true
Bump Chartclose

(full meta data to go here)

Dominik Koch  •  2018  •  Impressum  •  Datenschutz

Theme by beautiful-jekyll