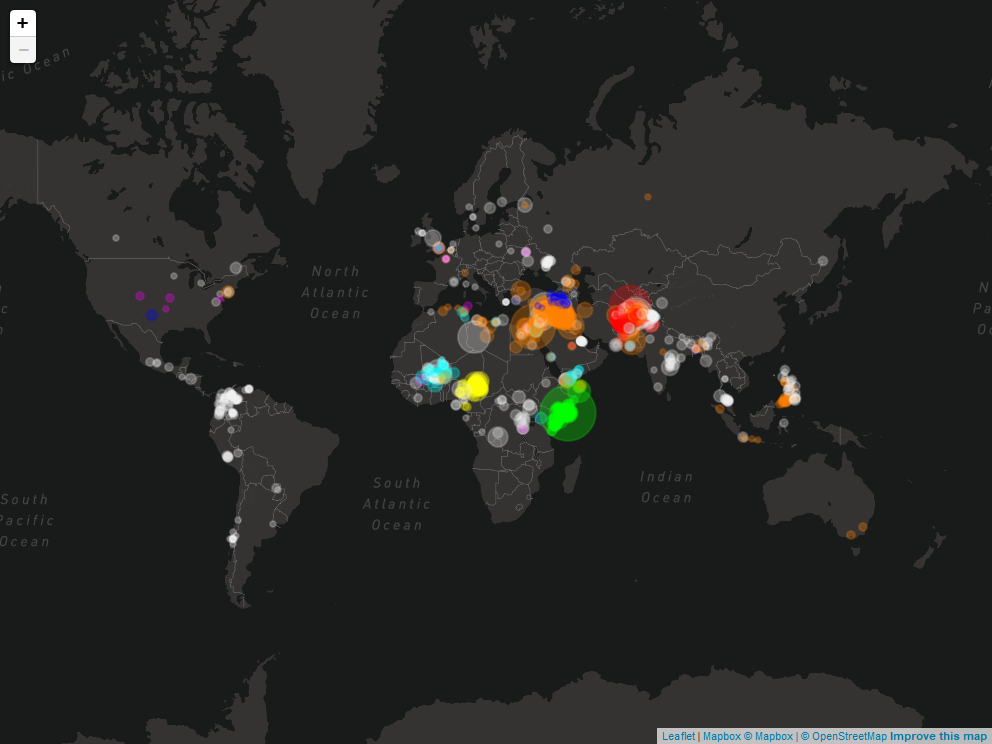
Since the rise and fall of the Islamic State of Iraq and the Levant (ISIS), almost no day passes without another terrorist attack in some part of the world. Though, in western media only a small number of attacks are mentioned. Reports are limited to attacks where countrymen have lost their lives or which were particularly devastating. In the Middle East and parts of Africa however, terror is part of everyday life.
To highlight these cruel terrorist attacks I plotted all incidents from 2015 until today on an interactive leaflet map based on crowdsourced wikipedia data. Each of the 3.925 incidents is plotted as an individual circle. The size of the circle correlates to the number of victims and the colour represents the terror organization. I’ve focused on groups that are currently the most active. The remaining ones were grouped together as ‘others’.
Additional information for every incident can be invoked via a popup by clicking on one of the circles in the map or an item on the timeline. As with any crowdsourced data, it may contain spurious or objectionable data, which I do not take responsibility for. The same data is used to create a fancy webGL globe. This feature is still work in progress and will be changed in future versions.
Only by looking at all the data at once, you will realize the full extent of global terrorism.

Global Terrorism - Rshiny Dashboard
Global Terrorism - GitHub Repository
Where does the data come from?
The data is crowdsourced by Wikipedia. You can find Lists of terrorist incidents from 1970 to the present. I’m not using the open-source Global Terrorism Database (GTD) because this data is one year delayed and I want to include the most recent incidents.
How many times is the data updated?
At the moment this is still a manual process due to occasionally messy Wikipedia data. Therefore the data will be updated on a regular basis once per month. I might implement a real time data supply in the future.
How did you make this dashboard?
This dashboard is written in R and built with the Shiny web applications frame work. Shiny is an open source R package that provides an elegant and powerful web framework for building web applications without requiring HTML, CSS, or JavaScript knowledge.
Outlook
This project is still work in progress and I will add more features to it in the future. Any feedback for further improvement is highly appreciated.